Using Google Maps to Find Apiary SItes
Introduction
The article below, on using Google Maps to help find apiary locations, first appeared in the American Bee Journal in July 2017. The version of the article here has all of its original Google Maps, like Figure 9 (Google Maps, 2017) seen just below. The article begins with a couple of apiary photographs.
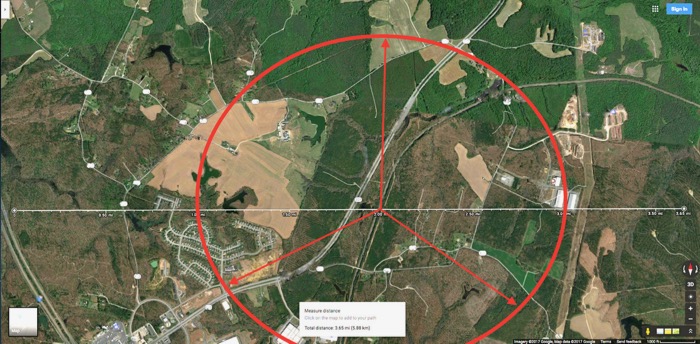
This is Figure 9 from the article. For its analysis see below.
Good apiary sites seem to be more difficult to find, at least in my area. The most important consideration is, of course, plenty of forage–both in the main Spring nectar flow and the Fall flow. If possible, some nectar dribbling in during the Summer dearth would be good too. A variety of pollen plants is important as well, beginning in early Spring, and ending in the Fall. If floral conditions are poor, move the beehives to a better location (see Figure I).
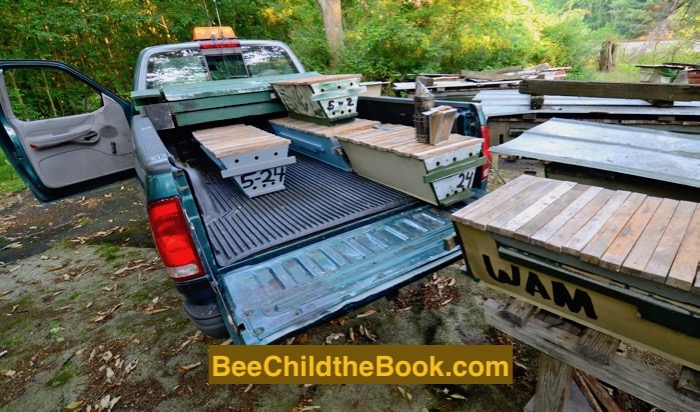
Figure I Loading top bar hives, moving to better forage. I just slide them aboard the truck from their elevated hive stands. All my top bar hives, including the frame hives below are set up to be very mobile, so I can more easily move them to better forage.
Do not think excellent bee management can overcome an apiary location that is deficient in nectar and pollen plants. Bees cannot make honey from suburban yards packed tight with pretty green grass or vast monocultures of pine trees replacing natural forests or logged-out land appearing like a desolate moonscape. Concrete and asphalt by the square mile are typically places to avoid too, unless ornamental bee forage can compensate. Some urban apiaries prosper quite well from plantings of flowers and trees that yield copious nectar and pollen. When I had apiaries in Raleigh, North Carolina near North Carolina State University, the diversity of flowers kept my bees working while my rural top bar apiaries languished in the Summer heat, until the return of cotton years ago. Now in Virginia, I still move hives to cotton (see Figure II).
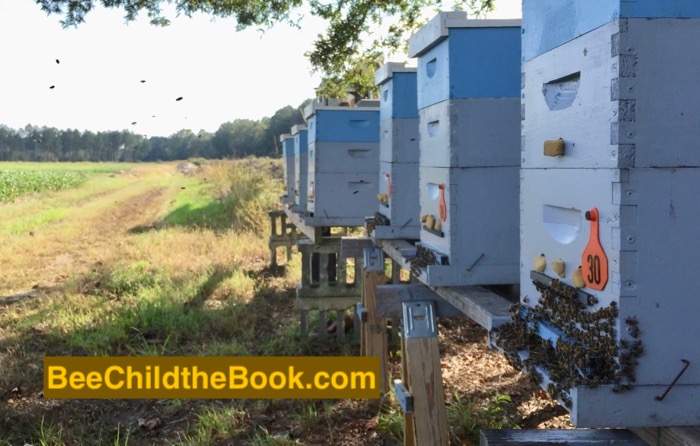
Figure II Some of my eight-frame hives returned home from summer cotton, with two full medium depth supers. These were first-year packages and swarms, built up on the spring nectar flow in their home apiaries. Then I moved them two hours away to locations near cotton farms. The hives gained more weight over the summer as the cotton bloomed. Back home, they weighed over 100 pounds each, the heaviest (not seen here) was 183 pounds requiring a third medium super. The colonies were strong and needed no fall feeding. This is the way I like to grow my new colonies by finding them locations with plenty of forage. These hives are for my thermal imaging research with bees in frame hives to complement my thermal work with top bar hives.
When hunting apiary sites the old way, out on the rural roads, driving around in unfamiliar places, one only had a sense of the bee forage from the road. The land’s interior could be vastly different in nectar and pollen plants. Usually that interior land remained completely unknown with all the expected no-trespassing signs and locked gates. It would be like trying to predict what was on a pizza by only knowing its crusty edge, an endeavor misleading from the beginning.
Now with Google Maps in satellite mode, beekeepers can see the interior vegetation of that land from above and at least avoid areas largely devoid of bee forage. In addition, we can see the possible bee forage around our existing apiaries. We can estimate the straight-line distance between apiaries while seeing the intervening bee forage. Taking a large-scale view of one’s out-apiaries, beekeepers can even see how to fit new apiaries near established ones, taking into account the local vegetation. The expansion of new out-apiaries can avoid areas seemingly deficient in bee forage while extending into regions showing promise for increased nectar and pollen plants.
Setting up Google Maps
When using tools like Google Maps, first understand that different web browsers (Google Chrome, Internet Explorer, FireFox, Safari, etc.), could have different keyboard commands, including different mouse and track-pad gestures for changing the maps. Also the internet connection, whether it is from a computer or mobile device, could alter the input of commands. To begin, we need to start the software and become oriented to familiar local landmarks.
From a browser’s search bar, type https://maps.google.com/ or search for “google maps” and go to their home page. The software always wants to give me driving directions, which is not the aim of this application. The map may be set to a location from the previous use; if not, the map probably shows the United States. I leave the view in map view (like a road map). To zoom out (go higher), click the minus button at the lower right corner of the map. To zoom in (go lower), click the plus button at the lower right corner. Zoom in or out until the view looks like you are seeing a small map of your state. (The mouse or track pad controls can zoom too.) Notice the little yellow scale line down in the right corner of the map. The scale line tells how much distance on the screen translates into a measurement in feet (or miles). As you zoom in and out, the scale line changes.
Holding the mouse down, drag your home’s location to the middle of the screen and zoom in closer. In the lower left corner of the map, click the square labeled Satellite. The view changes like seeing the land from a low flying plane. Zoom down and look for local landmarks. Orient to them.
Find your dwelling, which probably has your home apiary. From there, you can move to other locations like you would drive along the roads to future apiary sites. From those locations, the beekeeper can study possible bee forage and potential difficulties of tentative apiary locations.
Across the United States, vastly different ecosystems show up on the maps. Without leaving my house in Virginia, I have “scouted” apiary sites in the arid Southwest. Since I have never kept bees in those ecosystems, places drastically different from the East coast, I cannot tell a good apiary site using a satellite view over, say, Arizona. Therefore given your local situation, expect some regional learning. Spend some time seeing the features of your local lands. Take screen shots (so that the computer or iPhone takes a picture of its screen). Keep them in a folder as reference photographs (like the Figures 1-9 shown below).
Google Maps with Bee Forage Information
For this article, I show below introductory examples from Piedmont Virginia. While it is tempting to seek a general rule to tell if a map shows a good or poor apiary site, so far I have found the predictions have been too complicated. Whatever guidelines I describe, there are probably counter examples.
When out searching for new apiary sites, I am almost “programmed” from birth to find Tulip Poplar trees, one of our main nectar trees for the Spring. Of course I can identify the tree in the Spring, when lush and green, full of flowers and leaves. I also hunt apiary sites in the Winter. I can spot Tulip Poplars in the cold and snow, even from across a huge field, by its bare branches. (The tree has a characteristic pointed shape.) Driving on the highway, a big log truck, loaded with trees, rushes by the other way. I can tell it is a load of Tulip Poplars by just a glance, the tree bark passing by mostly in a blur. (The bark is different from oak, pine, and gumball trees.)
With Google Maps in satellite view, seeing Tulip Poplars is quite limited. I figure roughly the Tulip Poplars will be among other deciduous trees (trees that become leafless in the Winter). As best as I can tell, deciduous trees appear as in Figure 1 (Google Maps, 2017) when the picture was taken in the warm months.
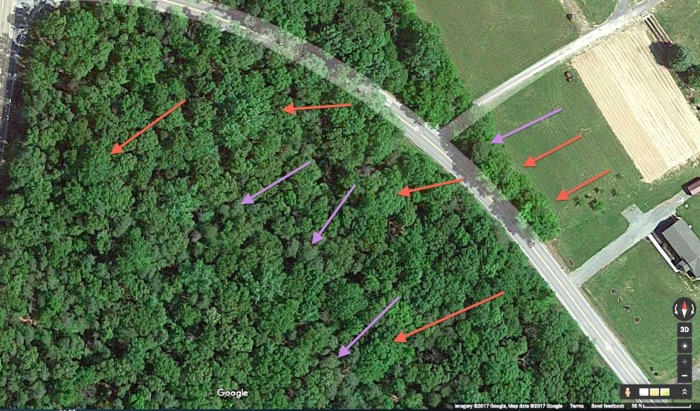
Figure 1 Mostly deciduous trees during the warm months. As a rough approximation, deciduous trees appear broader and brighter. Pine trees appear “finer” and a duller dark green, although that probably does not characterize all of them. Orange arrows point to the more prominent deciduous trees. Purple arrows indicate some of the interspersed pine trees. As a check, I found this place and located the pine tree shown by the far right purple arrow and the deciduous trees beside that pine tree. While I would include this deciduous forest as having possible Tulip Poplar trees, in fact I think, there were not very many.
Deciduous trees appear bare in the Winter (see Figure 2; Google Maps, 2017). Of course, the deciduous trees could be mostly an oak climax ecosystem with virtually no Tulip Poplars, rendering this method somewhat crude. The difficulty is because I cannot tell the difference between Tulip Poplars and oaks or other deciduous trees.
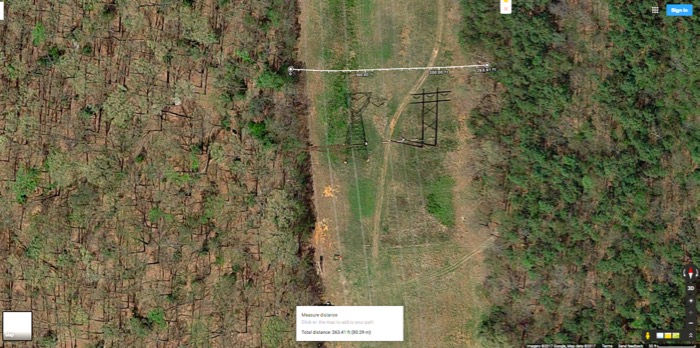
Figure 2 Types of trees by high voltage power lines. The right-of way bisects the picture. On the left, the woods appear bare. I am interpreting that as a deciduous forest in the Winter, or perhaps early Spring. The dull green is an interspersed scattering of pine trees. On the right, pines predominate. Leafless deciduous trees break up the pine canopy to show the brownish ground below. A pair of high-voltage towers are in the cleared right-of-way. The scaled distance axis that I inserted across the clearing under the towers was 263 ft wide (80.2 m).
Another complication is that some pine trees might appear as deciduous trees. I definitely avoid large areas of pines, which could be planted pines if they seem to form linear rows, the way they were planted (see Figure 3; Google Maps, 2017).
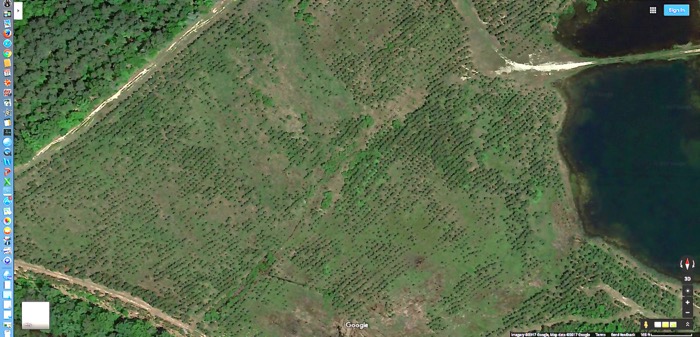
Figure 3 Planted pine trees. The row spacing may not be as obvious as shown here when the trees grow larger. In the upper left corner are older planted pines with a border of deciduous trees by the dirt road. From the road, the deciduous tree border can hide the much larger area deficient in bee forage.
Large cultivated fields are essentially bee deserts if the crop rotation produces no nectar or nutritious pollen (see Figure 4; Google Maps, 2017). For example, around some of my apiaries, the crop rotation is winter wheat, soybeans (which very rarely yield nectar in Piedmont Virginia), and corn (that yields air-borne pollen of poor nutritional value to bees). On the other hand, if cotton is in the rotation, the bees will produce honey for most of the Summer, sometimes used to blend with other honeys. Likewise, in some areas soybeans yield copious nectar to become a honey crop. To distinguish a particular situation (crop rotation), the beekeeper could visit the area and find out by asking the locals. The satellite view cannot tell everything. Firsthand visits remain necessary, which will be a recurring theme.
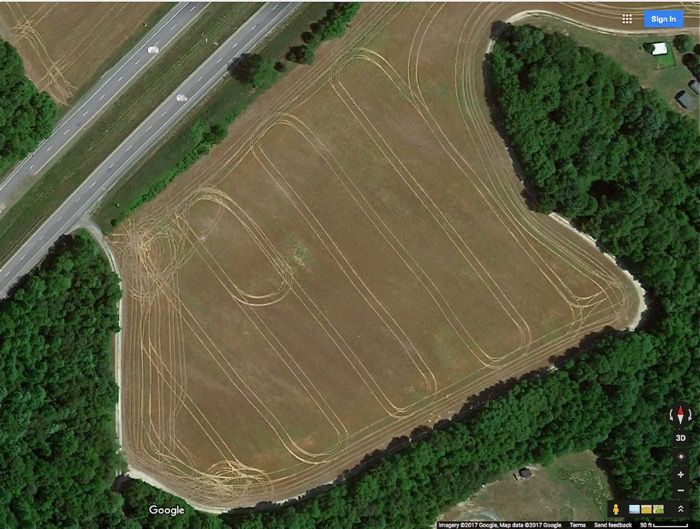
Figure 4 A cultivated field. Not all cultivated fields will have tracks from tractors.
Pastures for cows could have forage for bees if white clover (Ladino) is present (see Figure 5; Google Maps, 2017). White clover helps maintain the health of the pasture. In my area, white clover can extend the nectar flow into late June, provided conditions do not become too dry for the shallow-rooted plants.
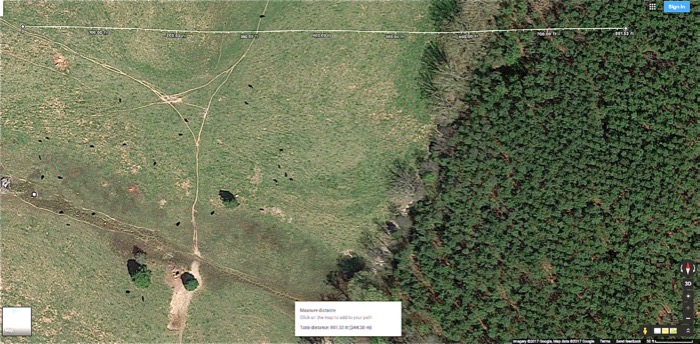
Figure 5 Tiny ant cows. The livestock show up more as shadows because of the sun, low in the sky, when the satellite took the photograph. Notice the planted pine trees on the right. Without clover in the field, this entire view is essentially a desert for bees. However if searching for water for an apiary site, the brown streak running through the lower part of the pasture just above the pair of trees, might be a shallow creek line. Note how the cow paths intersect as a triangle. Apparently cows do not turn “sharply,” but rather more gradually.
Hayfields rarely offer my bees any resources. On the satellite maps, I have seen large circular rolls of cattle hay in and beside hayfields (see Figure 6; Google Maps, 2017). Distinguishing the two types of fields usually calls for a site visit if the field is adjacent to a road. The visit is best done when the white clover is blooming making it more prominent.
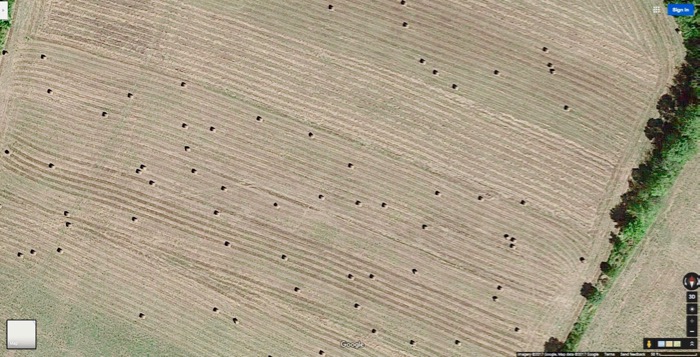
Figure 6 A hay field with large rolls of hay. The hay rolls just happened to be in the field when the satellite took the photographs. More often the mowing pattern may help distinguish the field use. The hay rolls serve as a reminder that conditions can change since the satellite took the photographs. Considerable clear-cut logging has occurred around some of my apiaries since the satellites took their photographs, still showing trees.
Long straight wide lines, much larger than roads, are power lines (see Figure 7; Google Maps, 2017). I do not mind having high-voltage right-of-ways intersecting the foraging areas of my apiaries. Although periodically the power company mows under these high voltage lines, usually plenty of wild flowers remain.
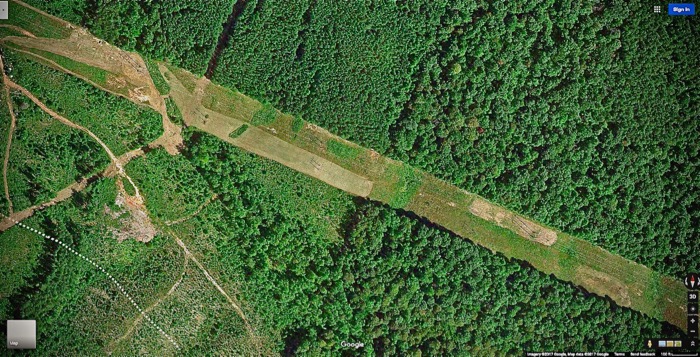
Figure 7 Power lines seen from high up. The patchwork appearance under the high-voltage lines is from mowing different sections at various times. Similarly the surrounding wooded area shows different amounts of growth from logging at different times. After logging, beekeepers tell me for a few years the forage will be good for bees (before the trees grow back). I see scant wild flower growth when hiking these places, trying to see for myself. Moreover, even a mildly dry Summer reduces the nectar production in wild flowers. Sometimes the amount of nectar becomes so meager, honeybees will not accept it. Other bee species, and also moths, will continue foraging because they accept smaller nectar rewards.
Generally, I like to see a diversity of features promoting bee forage all around a proposed apiary site, and I want that pattern to extend out at least for the first two or three miles from the hives. We know bees travel further from the hive, but closer forage is usually better. Figure 8 (Google Maps, 2017) shows a configuration similar to some of my better apiary locations.
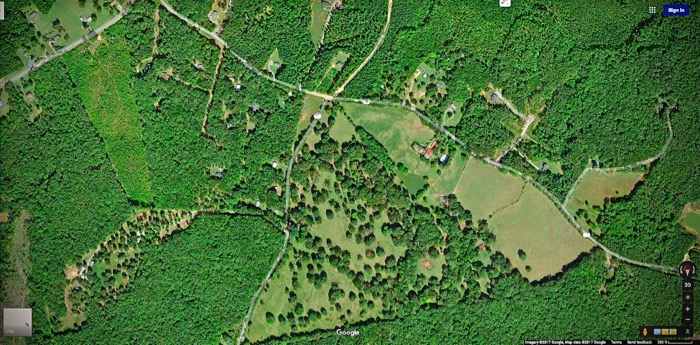
Figure 8 Potentially a good vicinity for an apiary. From my apiary hunting, just “roaming” among the Google maps, I came across this area. If those are clover fields in the triangular area containing the scattering of trees, this vicinity could be very favorable for bees. I would want the apiary near the center of the map. One concern: look around the edges of the map. See how thick woods seem to frame the picture. Too much thick woods going out further (a pattern change) reduce the diversity, and could reduce the quality of the site. I did not insert a scale, but the automatic one was 200 feet (61m) for the line in the lower right corner.
Matters can be complicated since sometimes I see a similar diversity around more marginal apiary locations, although most had large features known to be deficient in nectar (see Figure 9; Google Maps, 2017). Therefore, the beekeeper still needs to test out a new apiary site for up to three seasons to figure out its performance. On the other hand, the map can help a beekeeper avoid large features devoid of nectar that may not be apparent from a roadside view as we saw in Figure 3 (Google Maps, 2017), where the deciduous trees hid the planted pines, a situation I have seen several times.
Figure 9 Potentially a poor vicinity for an apiary. I placed a distance scale across the picture, which is 3.7 miles wide (6 km). The red circle is one mile (1.6 km) from the center, the location of the proposed apiary. The three arrows divide the circle into thirds. The brownish regions of the upper right and lower one-third of the circle are recently logged out areas. The huge light-brown cultivated field and the planted pines (closer to the center) dominate the upper left one-third of the circle. I drove through this vicinity, and it appeared a poor site from the ground too.
Google Maps is an innovative use of new technology to help beekeepers find apiary locations that will help provide their bees enough nectar and pollen plants for their bees to prosper. This Google Maps application comes when bees are having a difficult time surviving, due to a number of factors, one of which is the loss of large regions of nectar and pollen bearing plants (also known as habitat destruction).
References
Google Maps (2017). Imagery © Commonwealth of Virginia, DigitalGlobe, USDA Farm Service Agency, Map data © 2017 Google. Retrieved from https://maps.google.com/ (The additional code specifying map coordinates was removed for security.)